

Understanding sports’ carbon emissions
Counting carbon emissions accurately is a complex and technical business, but this guide will take a look at two important accounting conventions and draw on a number of case studies to show where the biggest contributions to sports’ carbon footprints lie.
Global heating is produced not only by the emission of carbon dioxide in the atmosphere but by a number of other gases too, most notably methane, which is a product of, amongst other things, meat and dairy farming. In fact, methane, molecule for molecule, has a much greater heating effect than carbon dioxide.
To allow all of these different gases’ impacts to be considered together, the basic unit of measurement used is tonnes of CO2 equivalent or tCO2e for short. As methane has around four times the impact of carbon dioxide, emitting 1 tonne of methane would be recorded as 4 tCO2e.
In the most widely used international accounting tool, the Greenhouse Gas Protocol, emissions are categorised into three groups or ‘scopes’ depending on how they have been produced.
- Scope 1 refers to direct emissions from processes owned or controlled by an organisation. This would include on-site fossil fuel use for power and heating.
- Scope 2 covers the emissions generated by electricity, steam, heating, and cooling purchased by an organisation.
- Scope 3 covers all the emissions associated with processes and consumption in an organisation’s value chain.
In the case of sports organisations this could include:
- purchased goods and services – including sports and office equipment, employee catering
- athlete and employee travel
- spectator travel
- waste disposal, especially from event catering
The case studies below, which are amongst the best-documented carbon audits in global sport, take a look at:
Wolfsburg, the Bundesliga team, is a leader in the response by German football to the climate crisis.
Its 2020 carbon calculation showed scope 1 and 2 emissions made up just 20 per cent of the total, and this was mainly for heating.
Scope 3 emissions made up 80 per cent of the club’s total emissions.
60 per cent of the club’s total emissions came from fan travel, eight per cent from team and employee travel, and five per cent from catering and merchandising.
While the precise ratios vary from sport to sport and club to club, the figures from Wolfsburg are a pretty good guide for most of the professional sports world.
Figure: CO2 footprint
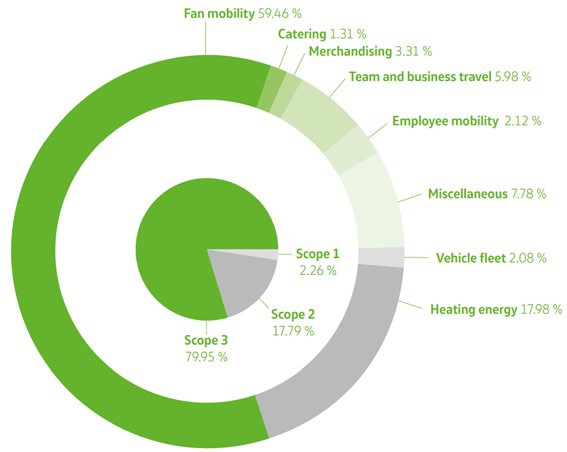
Source: Moving Together: Sustainability Report of VFL Wolfsburg 2020
In November 2021, Tottenham Hotspurs hosted Chelsea in what it called the first net zero game in the Premier League.
Total emissions from the game were 862 tonnes of carbon equivalent.
Fan travel and accommodation accounted for over 90 per cent of emissions from the game, and the majority of that came from car use.
This may not sound like very much, but there are 380 games in a Premier League season. On this basis alone, the English Premier League (EPL) is probably emitting 0.4 million tCO2e every year.
However, this game had considerably lower emissions than most because:
- First, a whole range of low carbon initiatives were already in place at Spurs’ new stadium – including the use of 100 per cent renewable energy at White Hart Lane –or were launched to lower the overall emissions of this game, like using biofuels to power both team’s coaches.
- Second, many games in a Premier League season would have entailed longer travel distances of fans, and thus higher emissions, than a London derby with excellent public transport links.
- Third, Spurs decided to exclude the emissions generated by fans who flew to the game – calculated at 229 tCO2e, which is almost a quarter of the reported total – on the curious grounds that fans might have made the flight anyway. However, with hundreds of thousands of overseas visitors coming to see EPL games every year, this seems an unreasonable assumption.
Therefore, a more reasonable estimate of the EPL’s annual footprint is closer to 0.7 million tonnes a year.
Given that just as many people are going to see lower league football as the EPL, and that the emissions associated with cup competitions, women and youth teams, and training facilities should also be added, English professional football’s annual emissions are easily in the order of 1 million tCO2e.
Table: Spurs vs Chelsea carbon emissions
|
|
tCO2e |
Proportion |
|
Energy |
1.4 |
<1% |
|
Water, wastewater, and waste |
4.7 |
<1% |
|
Employee commuting, both squads travel and Chelsea hotel stays |
1.5 |
<1% |
|
Fan travel and hotel stays |
805.7 |
93% |
|
Materials/consumables |
44.4 |
5% |
|
Misc |
4.1 |
<1% |
|
Total |
861.9 |
|
Source: www.skygroup.sky/game.zero
Table: Spurs vs Chelsea fan travel emissions
|
Emissions source from fan travel |
GHG emissions (tCO2e) |
Proportion |
|
Car |
560.8 |
70% |
|
262.0 |
|
|
257.8 |
|
|
25.5 |
|
|
9.9 |
|
|
5.6 |
|
|
Motorbike |
1.3 |
<1% |
|
Rail |
143.8 |
18% |
|
Bus/Coach |
16.7 |
2% |
|
Hotel |
83.0 |
10% |
|
Walk/Cycle |
0 |
0% |
|
Total |
805.6 |
|
Source: www.skygroup.sky/game.zero
Data on American sports’ carbon emissions remains fragmentary, but some useful work has been done, and on that basis, some plausible estimates can be made about what the scale of the problem might be.
Major League Baseball (MLB)
In 2018, a carbon audit of the MLB club, the Tampa Bay Rays, suggested annual emissions including fan travel of 35,000 tCO2e.
As one of just 32 franchises, this would give a figure for MLB as whole of around 1.1 million tCO2e.
Tampa, though, is far from the most well-attended team; in fact, it was 30th out of 32 in 2020. Adjusting for this, a figure between 1.5 and 2 million tCO2e for MLB’s annual emissions is easily plausible.
National Hockey League (NHL)
The NHL’s 2018 sustainability report estimated that the league’s total carbon emissions in 2014 were 0.189 million tCO2e and that this declined to 0.182 million tCO2e in 2016.
However, the NHL decided only to include team travel in their scope 3 calculations. If emissions from fan travel were added so that scope 3 emissions – in line with other sports – were around 70 per cent of the total, then the league’s annual emission would be closer to 0.6-0.7 million tCO2e.
FIFA has conducted carbon audits of the last four men’s World Cups – South Africa 2010, Brazil 2014, Russia 2018 and Qatar 2022.
As with other sports events, fan travel is the most important contributor to emissions. Given the global reach of the tournaments and the ubiquity of aviation, this makes up a bigger share of total emissions than in national leagues – as high as 83 per cent in Brazil in 2014.
Qatar 2022 was also very heavy on flying, but there has been considerably more construction work than at the other World Cups, accounting for 20 per cent of emissions alone. Adding accommodation-related emissions to fan travel brings the figure closer to the norm of around 70 per cent.
Recent work by Carbon Market Watch suggests that the organisers of Qatar 2022 have radically underestimated the carbon emissions associated with stadium and facility construction by as much as 2 million tCO2e.
Table: FIFA men’s World Cup carbon emissions (million tCO2e), and fan/athlete travel as percentage of emissions
|
|
Carbon emissions (million tCO2e) |
Fan/athlete travel percentage of emissions |
|
South Africa 2010 |
2.75 |
67 |
|
Brazil 2014 |
2.27 |
83 |
|
Russia 2018 |
2.16 |
74 |
|
Qatar 2022 |
3.63 |
51 |
The IOC and local organisers have been publishing environmental and carbon audits for almost two decades.
For the Summer Games see Athens 2004, Beijing 2008, London 2012, Rio 2016, and Tokyo 2020.
For the Winter Games see Vancouver 2010, Sochi 2014, Pyeongchang 2018, and Beijing 2022.
How emissions have been calculated has become steadily stricter and more encompassing. In 2018, the IOC published its most recent and stringent carbon footprint methodology to which all Olympic Games must now conform.
It is likely then that the figures below for Beijing 2008 and Vancouver 2010 are considerable underestimates.
The recent drop in emissions at Tokyo 2020 (held over till 2021) and Beijing 2022 are overwhelmingly because COVID restrictions meant almost no foreign spectators attended these Games and only very few locals.
Table: Summer Olympics carbon emissions (million tCO2e)
|
|
Carbon emissions (million tCO2e) |
|
Beijing 2008 |
1.18 |
|
London 2012 |
3.3 |
|
Rio 2016 |
3.6 |
|
Tokyo 2020 |
1.96-2.42 |
Table: Winter Olympics carbon emissions (million tCO2e)
|
|
Carbon emissions (million tCO2e) |
|
Vancouver 2010 |
0.27 |
|
Sochi 2014 |
0.52 |
|
Pyeongchang 2018 |
1.64 |
|
Beijing 2022 |
0.49 |
A thought experiment: Estimating global sports’ total carbon emissions
Given all the complexities and inconsistencies of emission reporting, not to mention the huge numbers of organisations that have yet to deliver a carbon audit, it is only possible to estimate the sports industry’s carbon footprint but this section makes an attempt in the form of a thought experiment.
Using case studies on sport’s carbon emissions as a guide, this section also discusses what might be the total global emissions of the sports industry. It takes the international championship circuits and the big professional leagues as its starting point and then extrapolates the figures to include other leagues and sports. The estimate is then put into the context of overall CO2 emissions to ask what the real contribution of limiting sports’ carbon footprint would be.
Read the full article 'A thought experiment: Estimating global sports’ total carbon emissions'


